Campaign Reporting
- Key Segment under Campaign Management displaying comprehensive data from both ASA and integrated MMPs.
- Provides a wide range of filters and metrics to customize reports based on user preferences.
Firstly, all the Metrics that are there on Newton -


The List of Metrics consist -
- Impressions: Number of times the ad is displayed to users.
- Taps: Number of times users tap on the ad.
- Downloads (Tap-Through): Number of app downloads initiated after tapping on the ad.
- Cost: Total expense incurred for the campaign.
- Spends: Amount spent on the campaign so far.
- New Downloads (Tap-Through): Downloads by new users after tapping on the ad.
- Re-Downloads (Tap-Through): Downloads by returning users after tapping on the ad.
- TTR% (Tap-Through Rate): Percentage of impressions that resulted in a tap.
- CR% (Conversion Rate) (Tap-Through): Percentage of taps that resulted in downloads.
- CPT (Cost Per Tap): Average cost incurred per tap on the ad.
- CPM (Cost Per Mille): Cost per 1,000 ad impressions.
- CPD (Tap-Through): Cost incurred per download after tapping on the ad.
- SPD (Spends Per Download): Average spend amount per download.
- Goal%: Percentage of achieved goals compared to the target.
- CPG (Cost Per Goal): Cost incurred for achieving a single goal.
- SPG (Spends Per Goal): Amount spent to achieve a single goal.
- Install Rate: Percentage of app installs relative to ad activity.
- Installs: Total number of app installs generated by the campaign.
- Goals: Specific objectives achieved during the campaign (e.g., purchases, sign-ups).
- Total Events: Total number of user actions triggered by the ad (e.g., clicks, installs).
- Avg Daily Cost: Average daily expenditure for the campaign.
- Monthly Budget: Total budget allocated for the campaign over a month.
- Avg Daily Spends: Average daily spend from the campaign budget.
Monthly Budget -
- The Monthly Budget is the maximum amount an advertiser is willing to spend on a campaign within a calendar month.
- The user will be able to add the monthly budget for an app directly from the table. They will be able to edit the budget by clicking directly on the budget. The following popup will appear.
- Accepted Range - $10 - $100,00,00 to upto 2 decimal points.

-

Meaning of Recurring Budget

Newton Platform also gives user a option to Filter the data -
- Purpose: Filters allow users to view only the required, sorted data. Once applied, Newton handles the rest.
- Applicable Pages:
- Campaign Page
- Ad Group Page
- Keyword Page (primary focus)
- Applicable Pages:
- Filter Limit: Users can apply up to 7 filters simultaneously.
How to use Filters
- User can see the Filters option beside Action switch or above App Name column -
-
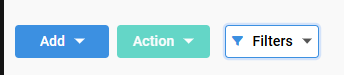
Location of Filter Button - Click Filters
- A dropdown list would be seen of all the metrics on which the user wants to filter
-
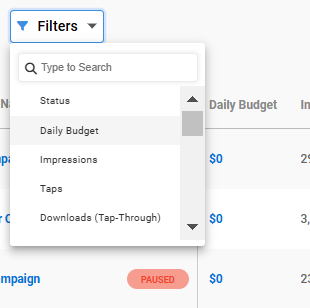
Filter Dropdown List - Select or search the Filter from the list
- A horizontal bar will be displayed just beside filters -
-

Filter>Operator>Value


- Select the operator -
-
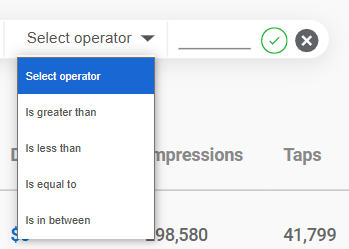
Operator Dropdown List - Enter the value
- Click the Green Tick button
- Check the results

Table Metrics -
- The feature allows users to view only the metrics they need, ensuring focus and efficiency.
- Quick Access: Located conveniently next to the search bar for easy access.
- Enhanced Productivity: Simplifies data analysis by eliminating unnecessary clutter.
-
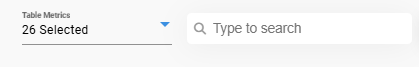
Location of Table Metrics

Steps to use Table Metrics -
- Navigate to Table Metrics and click on it.
- View all selected metrics displayed.
- Deselect any unnecessary metrics; the corresponding data will be hidden.
- Re-select metrics to make them visible again as needed.

Report Download -
- Purpose: Enables users to download table data for analysis and reporting.
- Available Options:
- All Campaigns: Comprehensive campaign-level data.
- Specific Ad Groups: Focused data for selected ad groups.
- Keyword Lists: Detailed keyword-level insights.
- Use Cases:
- Performance tracking.
- Strategy optimization.
- Shareable reports for stakeholders.
Where to Find the report Download Option -
- Report Download button is visible beside the search bar -
-
Location of Report Download

Steps to Use Report Download -
In case of Downloading without any changes -
- Select the data range
- Click on Download
- The file will be downloaded in .csv form
In case of Downloading with changes in the Table -
- Apply Filters according to requirement
- Deselect the metrics which are not needed simply by unselecting the metrics from Table Metrics dropdown list.
- Click on Download
- The file will be downloaded in .csv form