Campaign Data Visualization
- Comprehensive Dashboard: Gain quick insights into the performance of your campaigns and applications at a glance.
- Eight Major Metric Tiles:
- Impressions: Total views generated by your campaigns.
- Taps: Number of interactions initiated by users.
- Downloads: Successful app installations.
- Spends: Total investment in your campaigns.
- CR% (Conversion Rate): The percentage of users converting from taps to downloads.
- SPD (Spends Per Download): Average cost for each download.
- Goals: Campaign objectives achieved.
- SPG (Spends Per Goal): Cost incurred per achieved goal.

Further, user can see on the top, a row of seven sections, which are as following -
- Apps
- Campaigns
- Ad Groups
- Keywords
- Search Terms
- Ads
- CPP( Customized Product Page)

Chart Visualization -
Apps Page -
- Day-on-Day Visualization: Newton offers a day-on-day chart to compare trends for up to three selected apps based on a chosen metric.
- Metric Selection: The desired metric can be selected using the "Select Metric" dropdown, located in the top-left corner of the chart.
- App Selection: Up to three apps can be selected for comparison through the "Apps" dropdown, located in the top-right corner of the chart.
-
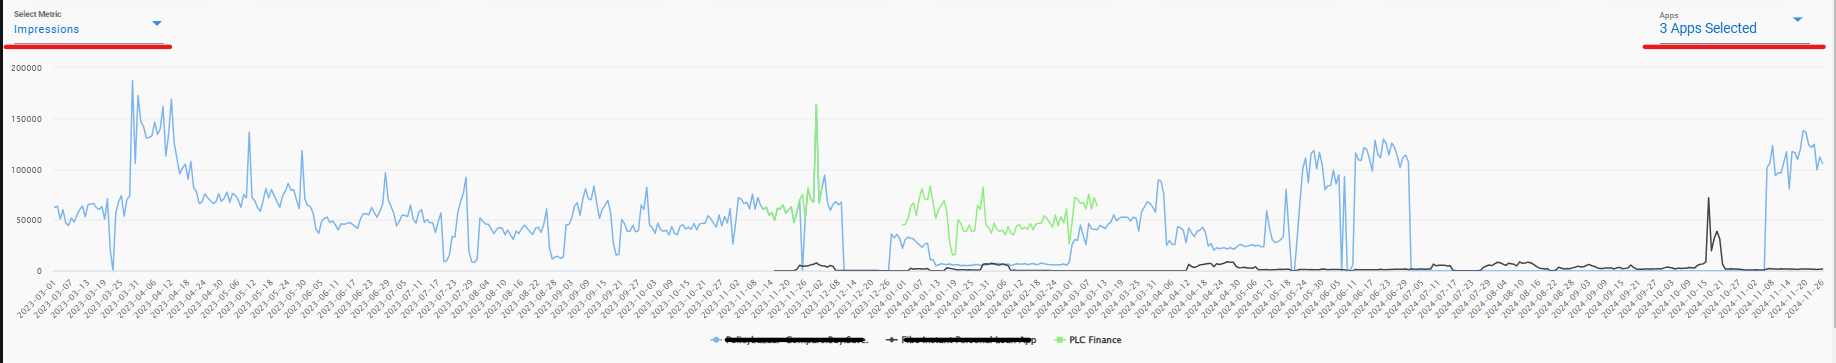
Chart Visualization Sample

The List of Metrics consist -
- Impressions
- Taps
- Downloads(Tap-Through)
- Cost
- Spends
- New Downloads(Tap-Through)
- Re-Downloads(Tap-Through)
- TTR%( Tap Through Rate)
- CR%(Conversion Rate)(Tap-Through)
- CPT (Cost Per Tap)
- CPM( Cost Per Mile)
- CPD(Tap-Through)
- SPD(Spends Per Downloads)
- Goal%
- CPG(Cost Per Goal)
- SPG(Spends Per Goal)
- Install Rate
- Installs
- Goals
- Total Events
- Avg Daily Cost
- Monthly Budget
- Avg Daily Spends
Campaign Page -
- On the Campaign Page as well, User can compare and have chart visualization of upto 5 Campaigns for the Metric Selected.
-
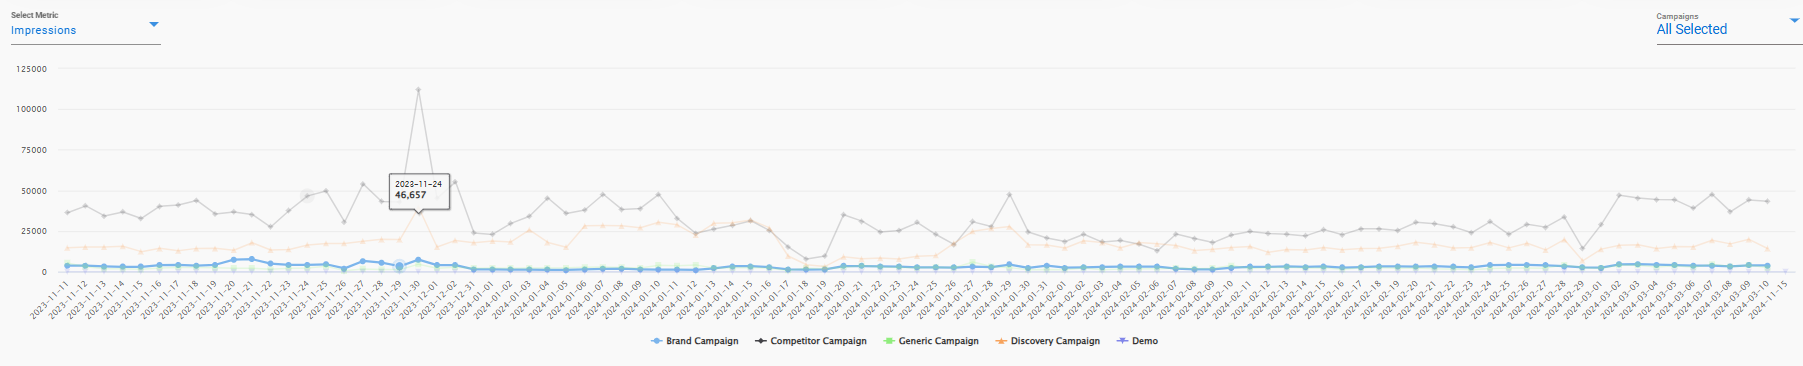
Campaign Chart Viusual

Ad Group Page -
- Similarly, the user can compare and get a chart visual of upto 5 Ad Groups at the same time for the particular Metric selected.
-
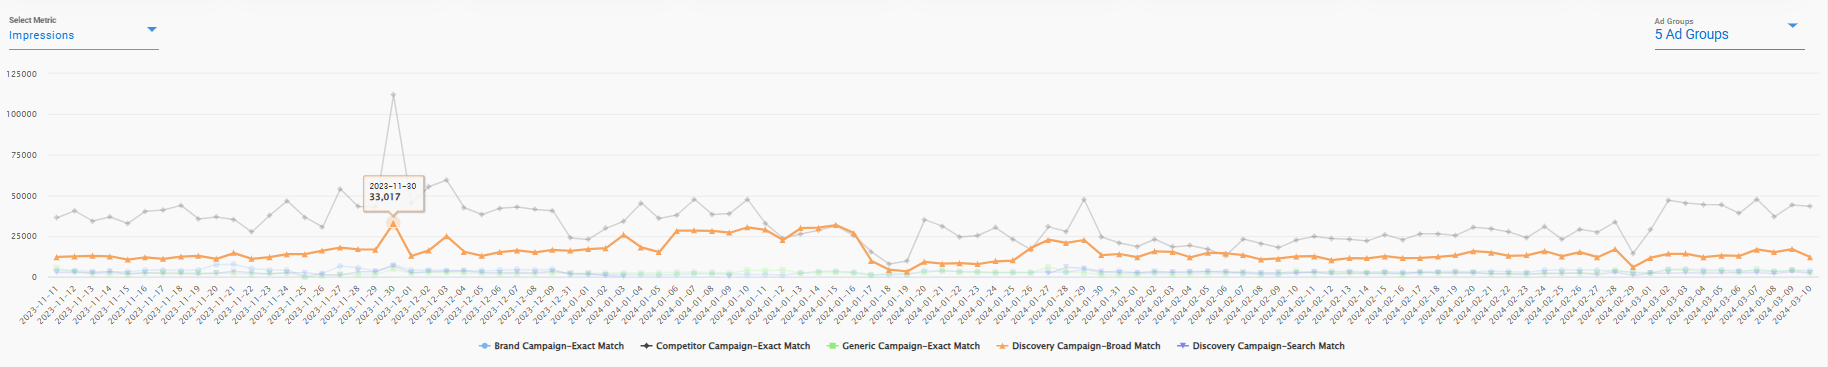
Ad Group Chart Visual

Keyword Page -
- Similarly, the user can compare and get a chart visual of upto 5 Keywords of a particular campaign or 5 in total from mix od all the campaigns at the same time for the particular Metric selected. -
-
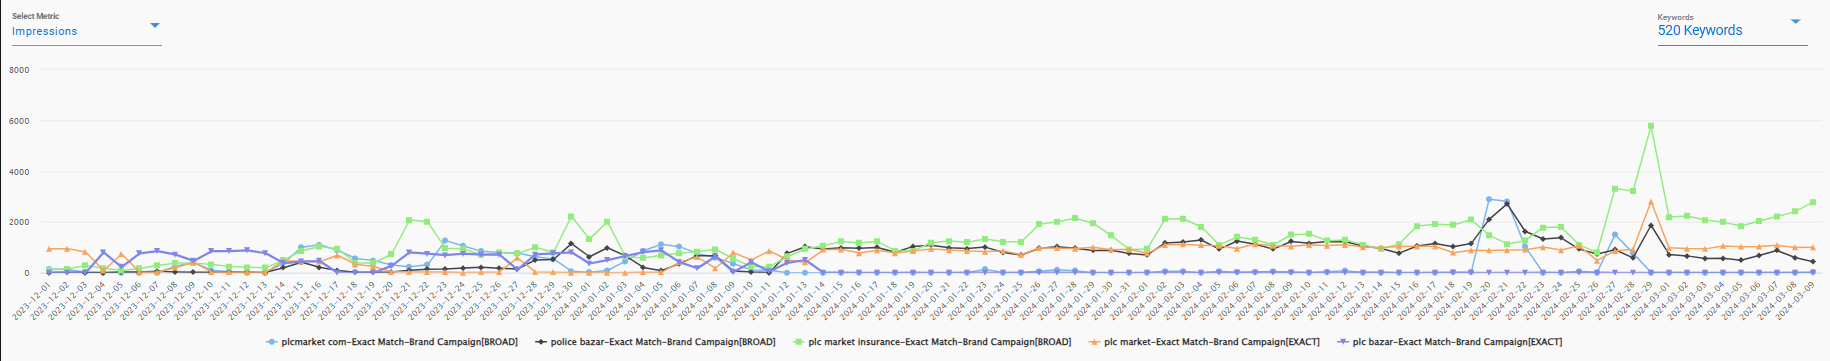
Keyword Visual Chart
